 Save as PDF
TE Data ==> Categories
The TE Categories is the place where the different available data sources can be organized in some structure that meets specific report requirements. Each category can be set up as a standalone category or in a parent-child relationship. Each category can can be linked to a single data source the values or produce another calculated value based on other category scores. The categories are the items that display on the reports and all of the data entry screens.
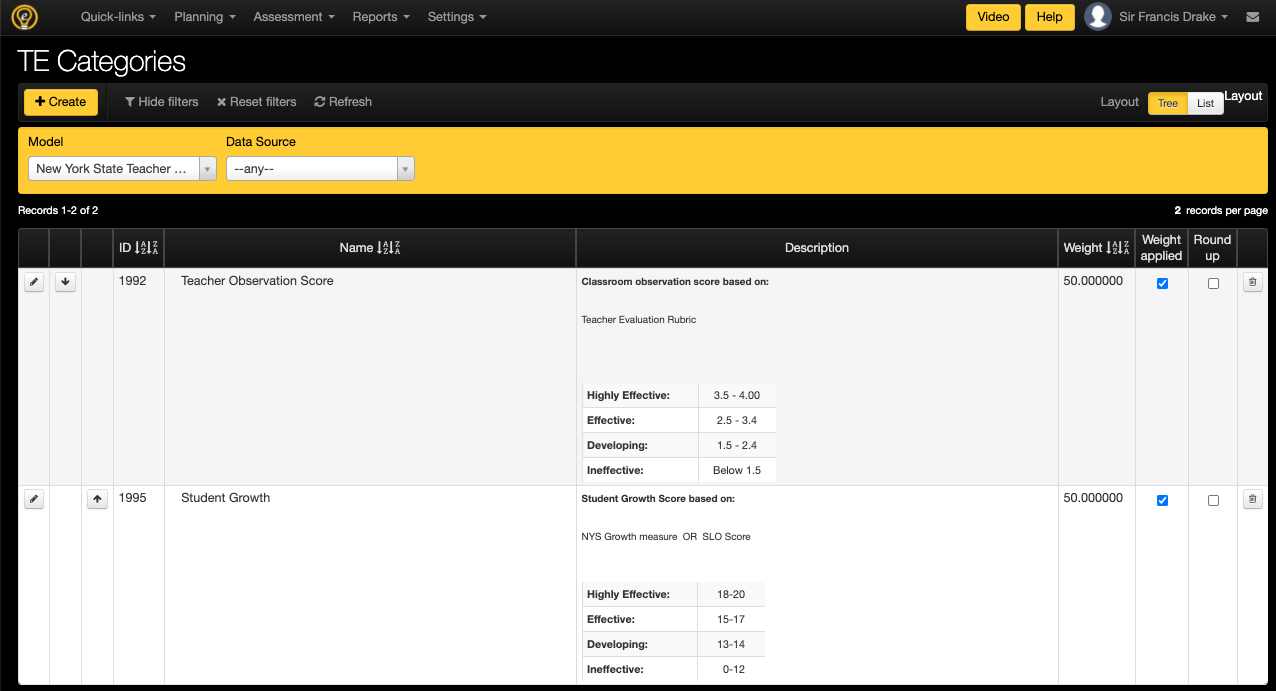
Here is a typical TE Category configuration for a NY district Teacher Effectiveness Report where the Observation data source is combined with the SLO data source, which are both weighted at 50% of the overall effectiveness score.
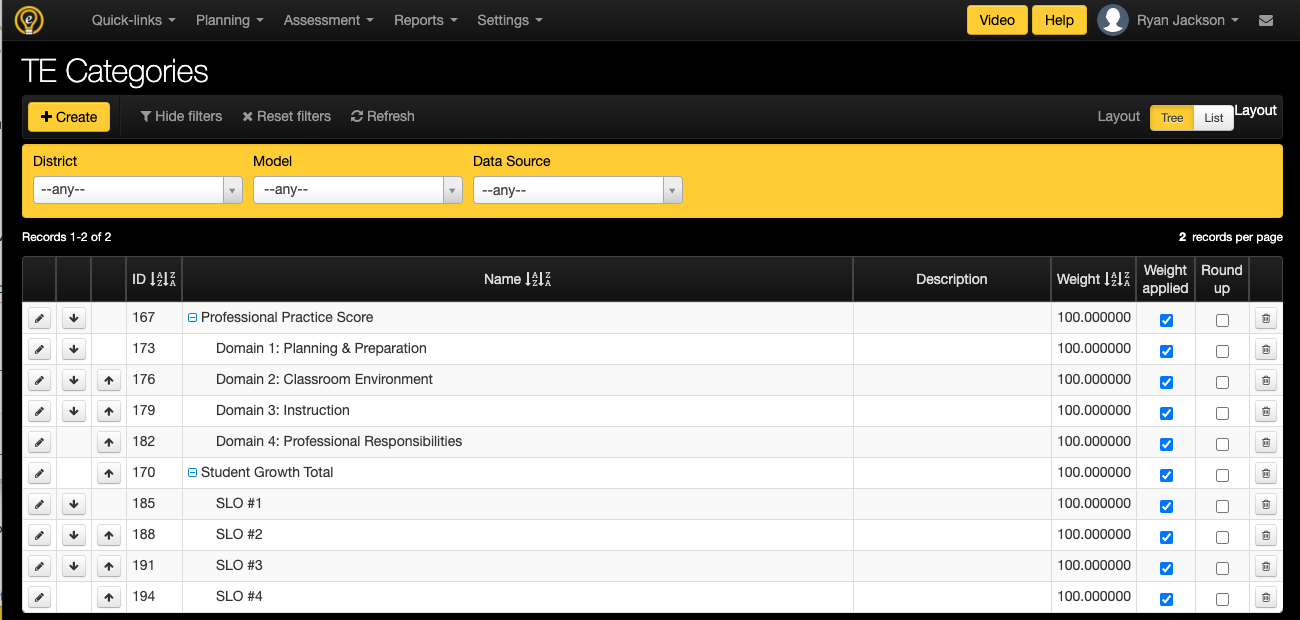
In other configuration, the overall education score may be based off a combination of other scores. In the example below you will find specific Domain scores as child categories to the the overall observation score as well as individual SLO scores that produce a value for the overall SLO score.
These are just two ways to configure the TE Categories based on Observation scores and SLO scores, but there are many other configurations to consider for other types of reports as well that can include a variety of different data sources.
 Clicking the edit pencil button will result in a pop-up where all of the details of the TE Category can be viewed or updated.
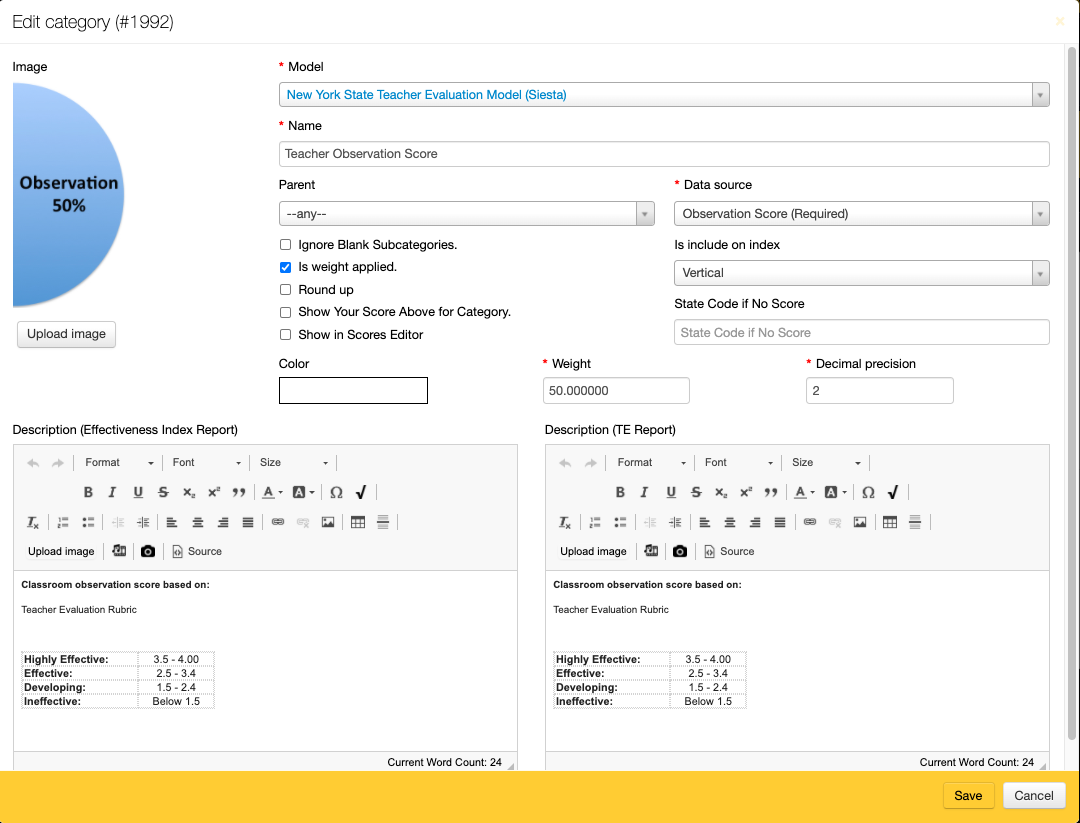
- Image: The image option allows for a single image to be uploaded to be included in the report when applicable.
- Model: It is required that a TE Category be linked to a Model that currently exists. In the pull-down is where all of the available active models can be chosen to link the category to.
- Name: The name is a required field and should reflect the name of the data that will be within this respective category. The name is how this Category will display throughout the system for printed reports and for data entry screens.
- Parent: If the Category is a subset of another value, then it is important to configure a parent-child relationship. Each Cateogry can be configured with or without a parent category and all of the existing categories will be available to select.
- Data Source: Each category is required to be linked to a Data Source so it can call upon this existing value for the model/report. All existing data sources can be selected to link to any category, but please note that each data source can only be used once per model/report.
- Is include on index: This selection is required if a Category is to be combined with another in some type of array. The available selections are 'Not Included', 'Vertical', and 'Horizontal'. For NY districts, the Observation category should be configured to be the Vertical index while the SLO score should be configured to be the Horizontal index (so the scores can be combined in a grid to arrive at an overall effectiveness rating. In other category configuration, the index is less important, but some will require that all categories be configured on the Vertical index. Select not included if the score is to not be combined with any other values.
- State Code if No Score: If the district is using the TE System to produce a state reporting file, this field becomes important if and only if empty scores are to be reported as well. Otherwise the state reporting codes are entered within the Category Scores to Effectiveness page. The code entered here will be the code that is linked to staff members that do not have a value in the data source for the target year.
- Ignore Blank Subcategories: This is a control that will allow a score to be calculated without all of the child categories being present. If this is not selected, the category scores will be calculated with a score of 0 if there is no score. If selected, the existing category scores will be calculated such that the weights are applied considering only the categories that have existing data.
- Is weight applied: The weight field will only be applicable when this checkbox is selected. Otherwise, the score will be displayed as it exists within the data source.
- Round Up: The selection works in correspondence with the decimal precision. If selected, the application will display existing values in the linked data source, but round them up to the next closest value in accordance with the entered decimal precision. For example, if the decimal precision is entered as 2 and the value is 3.452, the resulting value will be 3.46 to round up for two decimal places.
- Show You Score Above for Category: This is a specific control for some models that will display the scores of the categories in the report in a separate section. In example, some report may only consider the Observation and SLO score, but there may be a need to show the subcomponents in some other section.
- Show in Scores Editor: By default, any category that is configured will allow data to be entered manually through the Cateogry Scores page. This option exists in order to hide specific categories from being able to enter data manually. This is often used for calculated scores (parent categories).
- Color: To enhance the look and feel of any report, a category can be assigned a color for display purposes only.
- Weight: If weights are being applied for a parent, each child expectation should be provided their respective weight that should be assigned to to each category such that the overall value calculates in accordance with reporting guidelines.
- Decimal precision: This field should be populated if and only if the data source values should be rounded to a specified number of decimal places.
- Descriptions: Some models/reports are configured to include this description.